Making slow Rust code fast
Performance tuning using Criterion.rs and flamegraphs
Performance is one of the top reasons developers choose Rust for their applications. In fact, it's the first reason listed under the "Why Rust?" section on the rust-lang.org homepage, even before memory safety. This is for good reason too--many benchmarks show that software written in Rust is fast, sometimes even the fastest. This doesn't mean that everything written in Rust is guaranteed to be fast, though. In fact, it's surprisingly easy to write slow Rust code, especially when attempting to appease the borrow checker by cloning or Arc-ing instead of borrowing, a strategy which is generally recommended to new Rust users. That's why it's important to profile and benchmark Rust code to see where any bottlenecks are and to fix them, just like you would in any other language. In this post, I'll demonstrate some basic tools and techniques for doing so, based on my recent experience working to improve the performance of the mongodb crate.
Note: all the example code used in this post can be found here.
Index
- Profiling
- Attack of the
Clone - Speeding up deserialization
- Analyzing results
- Next Steps
- Conclusion
- Shameless plug
- References
- Acknowledgments
Profiling
Whenever doing any kind of performance tuning work, it is absolutely essential to profile the code before attempting to fix anything, since bottlenecks can often reside in unexpected places, and suspected bottlenecks are often not as impactful as assumed. Not adhering to this principle can lead to premature optimization, which may unnecessarily complicate the code and waste development time. This is also why newcomers are advised to liberally clone things when getting started--the clones can help with readability and probably won't have a serious impact on performance, but if they do, later profiling will reveal that, so there's no need to worry about them until then (this is the "full version" of the advice).
Benchmarking
The first step in profiling is to establish a set of consistent benchmarks that can be used to determine a baseline level of performance and to measure any incremental improvements. In the case of mongodb, the standardized set of MongoDB driver microbenchmarks worked nicely for this, especially since it allowed for comparisons between MongoDB drivers written in other programming languages. Being that these are "micro"-benchmarks, they also make it easy to measure changes in individual components (e.g. reads vs writes), which can be useful when focusing on making improvements in specific areas.
Once the benchmarks have been chosen, a stable environment should be set up that can be used to perform all the timing measurements. Ensuring the environment doesn't change and isn't doing other "work" (e.g. browsing through cat pictures) while profiling is important for reducing noise in the benchmark measurements.
Using cargo bench and Criterion.rs to run benchmarks
The nightly version of Rust comes with unstable support for creating and running benchmarks, and while it is useful for simple benchmarks, its features are limited and are not documented very well. Another option is the criterion crate, which provides much more configurable and feature-rich support for benchmarking, all the while working on stable Rust!
I'll detail a basic criterion setup here, but for more information I highly recommend checking out the excellent Criterion.rs User Guide.
When benchmarking mongodb, I first created a new project using cargo new <my-benchmark-project> and added the following lines to the Cargo.toml:
[dependencies]
tokio = { version = "1", features = ["full"] }
futures = { version = "0.3", default-features = false }
mongodb = { path = "/home/patrick/mongo-rust-driver" }

[dev-dependencies]
criterion = { version = "0.3.5", features = ["async_tokio", "html_reports"] }

[[bench]]
name = "find"
harness = false
For my benchmark, I used the tokio async runtime, so I needed to specify it as a dependency and enable the async_tokio criterion feature, but this isn't required if you're not using tokio. I also needed to use some functionality provided by the futures crate, but again this isn't necessary to run a criterion benchmark. For my mongodb dependency, I specified a path to a local clone of its repository so that I could benchmark any changes I made. Also, for this example I'll be focusing on benchmarking the mongodb crate's Collection::find method, so I named my benchmark accordingly, but you can name yours anything.
Next, a benches/find.rs file needs to be created to contain the benchmark. The file name needs to match the value specified in the name field in Cargo.toml. Here is an example of a simple benchmark which tests the performance of Collection::find:
use criterion::{criterion_group, criterion_main, Criterion};
use futures::TryStreamExt;
use mongodb::{
    bson::{doc, Document},
    Client,
};

pub fn find_bench(c: &mut Criterion) {
    // begin setup

    // create the tokio runtime to be used for the benchmarks
    let rt = tokio::runtime::Builder::new_multi_thread()
        .enable_all()
        .build()
        .unwrap();

    // seed the data server side, get a handle to the collection
    let collection = rt.block_on(async {
        let client = Client::with_uri_str("mongodb://localhost:27017")
            .await
            .unwrap();

        let collection = client.database("foo").collection("bar");
        collection.drop(None).await.unwrap();

        let doc = doc! {
            "hello": "world",
            "anotherKey": "anotherValue",
            "number": 1234
        };
        let docs = vec![&doc; 10_000];
        collection.insert_many(docs, None).await.unwrap();
        collection
    });
    // end setup

    c.bench_function("find", |b| {
        b.to_async(&rt).iter(|| {
            // begin measured portion of benchmark
            async {
                collection
                    .find(doc! {}, None)
                    .await
                    .unwrap()
                    .try_collect::<Vec<Document>>()
                    .await
                    .unwrap();
            }
        })
    });
}

criterion_group!(benches, find_bench);
criterion_main!(benches);
The find_bench function contains all the code for setting up and running the benchmark. The function can be named anything, but it needs to take in an &mut Criterion as a parameter. The first part of the function contains the setup code that is executed only once before the benchmark runs and whose runtime is not measured at all. The actual measured part is the closure that is passed into Bencher::iter later on. That closure will be run many times, and the timings for each run will be recorded, analyzed, and included in an HTML report.
In this particular example, the setup involves creating the tokio runtime that will be used for the rest of the benchmark. Normally, this is done behind the scenes via the tokio::main macro or, in the case of libraries, not at all. However, we need to manually create a runtime here so that we can pass it to criterion later via the Bencher::to_async method. Once the runtime has been created, the setup continues by populating the MongoDB collection that we'll be querying in the actual benchmark. Because this involves the usage of async APIs, we need to ensure they execute within the context of the async runtime via Runtime::block_on. In the actual measured portion, we perform a query over all of the documents in the collection we created during setup.
For more information about the criterion functionality used in this example, check out the example found in the "Getting Started" section of the Criterion user guide.
With all that ready to go (and with our MongoDB instance running), we can run cargo bench to establish our baseline. The output will look something like the following:
~/benchmark-example$ cargo bench
    Finished bench [optimized] target(s) in 0.07s
     Running unittests (target/release/deps/benchmark_example-b9c25fd0639c5e9c)

running 0 tests

test result: ok. 0 passed; 0 failed; 0 ignored; 0 measured; 0 filtered out; finished in 0.00s

     Running unittests (target/release/deps/find-e1f66bfc9cf31158)
Gnuplot not found, using plotters backend
Benchmarking find: Warming up for 3.0000 s
find                    time:   [55.442 ms 55.663 ms 55.884 ms]
The most important information here is time: [55.442 ms 55.663 ms 55.884 ms]. The center value is the best estimate of the time taken for each iteration, and the first and last value define the upper and lower bounds of the confidence interval. By default, the confidence level used is 95%, which means there's a 95% chance that the interval contains the actual average runtime for an iteration. For more information on these values and how they're calculated, check out the Criterion.rs User Guide.
Now if we run cargo bench again, it will record more timings and compare them to the previous ones (prior data is stored in target/criterion), reporting any changes. Given that we haven't changed the code at all, this should report that nothing has changed:
find                    time:   [55.905 ms 56.127 ms 56.397 ms]
                        change: [+0.3049% +0.8337% +1.4904%] (p = 0.01 < 0.05)
                        Change within noise threshold.
Found 5 outliers among 100 measurements (5.00%)
  1 (1.00%) low mild
  2 (2.00%) high mild
  2 (2.00%) high severe
And as expected, criterion reports that any change in performance from the last run was likely due to noise. Now that we have established a baseline, it's time to profile the code to see where it's slow.
Using perf and cargo flamegraph to generate flamegraphs
perf is a Linux command line tool that can be used to obtain performance information about an application. We won't be using it directly, but rather through the flamegraph crate, which is a Rust-based flamegraph generator that works with cargo.
Flamegraphs are useful visualizations of the time spent by your program in each function. Each function called during an execution being measured is represented as a rectangle and each call stack as a stack of rectangles. The width of a given rectangle is proportional to the amount of time that was spent in that function, with wider rectangles meaning more time. Flamegraphs are incredibly useful for identifying slow portions of a program, as they can allow you to quickly identify in which parts of the codebase is a disproportionate amount of time is being spent.
To generate flamegraphs using cargo, first we need to install perf and the flamegraph crate. This can be done with the following on Ubuntu:
sudo apt-get install linux-tools-common linux-tools-`uname -r`
cargo install flamegraph
Once the installation is complete, we can generate the first flamegraph of our baseline! To do that, run the following:
cargo flamegraph --bench find -o find-baseline.svg -- --bench
Then you can view the flamegraph in your browser by opening find-baseline.svg. If you run into permissions issues running cargo flamegraph, see this note from the flamegraph crate's README.
Generating the flamegraph of a criterion benchmark can be noisy, since a lot of the time spent will be in criterion (e.g. for measuring time) and in the setup rather than in the portion being benchmarked. To cut down on some of that noise in the flamegraph, you can write a program that behaves similarly to the measured portion of the benchmark and generate a flamegraph of that instead.
For instance, I used the following command to generate a flamegraph from a regular binary application that uses my local copy of the mongodb crate to perform a find without criterion:
cargo flamegraph --bin my-binary -o find-baseline.svg
And here is the resulting flamegraph (open it in a new browser tab to explore):

Now that we can see where the time is being spent, it's time to dig in and see if we can find the bottlenecks.
Identifying bottlenecks in a flamegraph
The stacks in flamegraphs start at the bottom and move upwards as the call stack deepens (left vs right is arbitrary), and generally that's the best way to start reading them. Looking at the bottom of the above flamegraph, the widest rectangles are Future::poll, but that's not because Rust futures are super slow--it's because every .await involves polling futures. With that in mind, we can skip up from any poll rectangles until we can get to functions within mongodb to see the information we care about. The following annotated version of the flamegraph highlights the sections of note:
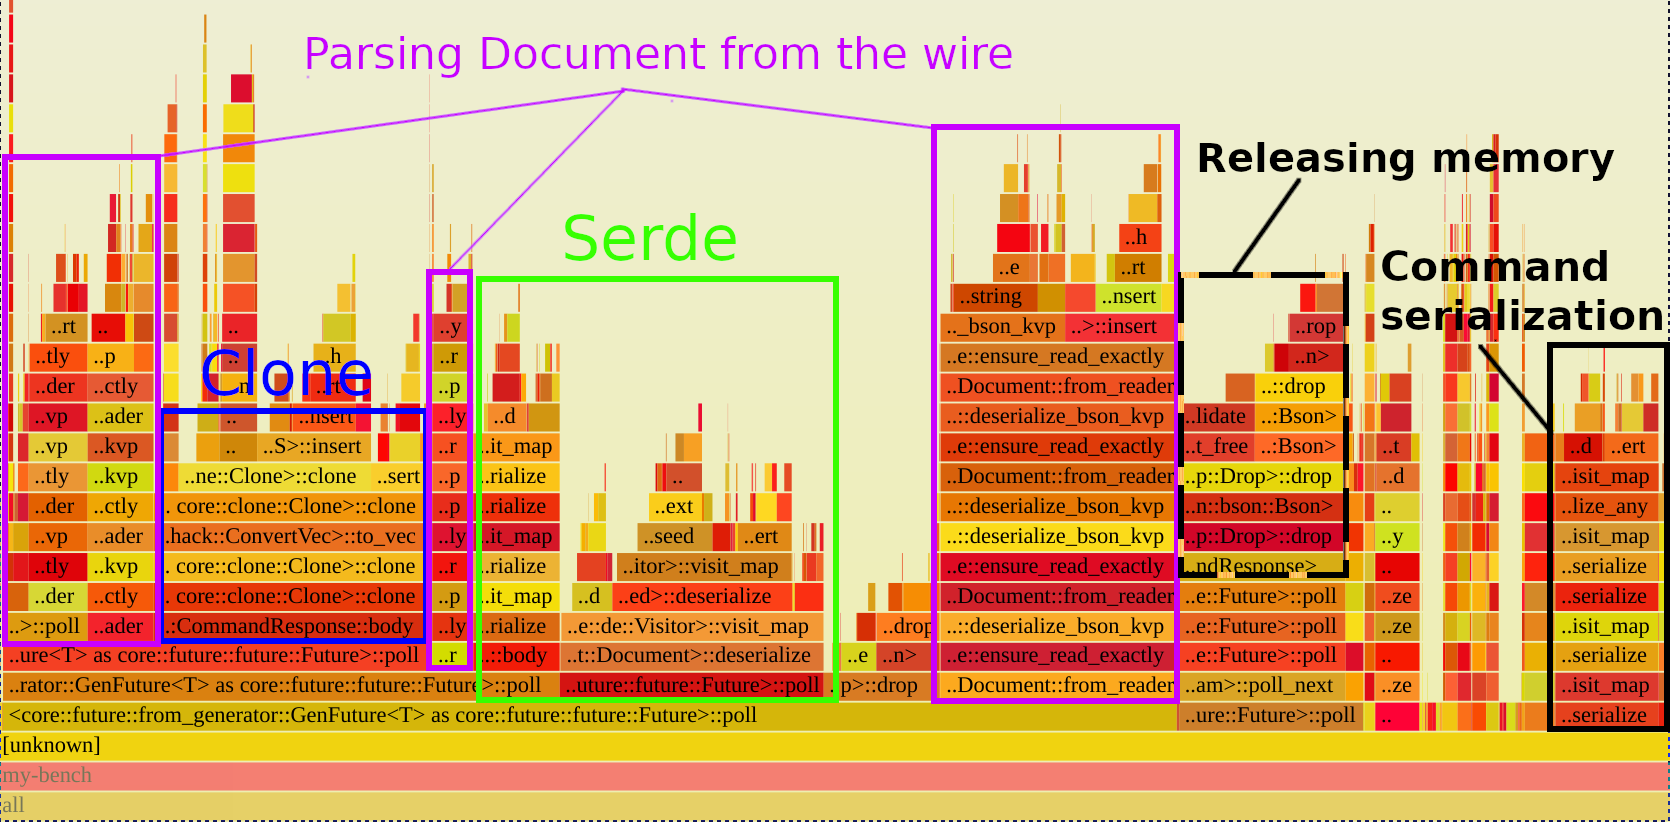
The blue square contains the time spent in the calls to CommandResponse::body, and it shows that nearly all of that time is spent in clone(). The various purple rectangles correspond to the time spent parsing BSON (the binary format used by MongoDB) into Documents, and the green rectangle corresponds to the time spent in Document's serde::Deserialize implementation. Lastly, the dotted black rectangle corresponds to the time spent releasing memory, and the solid black one corresponds to the time spent serializing commands to BSON.
Now that we know where most of the time is being spent (only in a handful of places), we can focus our efforts on actually changing the code to make it faster.
Attack of the Clone
As with any task, starting with the low-hanging fruit can often yield the best return on investment. In this case, a big chunk of time was spent in cloning alone (the blue rectangle above), so if we can simply eliminate the clones, we may be able to save all of that time. From the flamegraph, we know the most expensive clone is the one that is called in CommandResponse::body, so let's go investigate that method.
On command.rs:149, we have the following definition:
/// Deserialize the body of the response.
pub(crate) fn body<T: DeserializeOwned>(&self) -> Result<T> {
    match bson::from_bson(Bson::Document(self.raw_response.clone())) {
        Ok(body) => Ok(body),
        Err(e) => Err(ErrorKind::ResponseError {
            message: format!("{}", e),
        }
        .into()),
    }
}
As we can see, there is indeed a call to clone in here, so it's likely the one we saw taking a lot of time in the flamegraph. The clone is required because we need to deserialize from the raw_response owned by self, but we only have a reference to self, so we can't move out of it. We also can't use raw_response by reference because bson::from_bson expects an owned value. Let's investigate the places in which body itself is called to see if we can change it to take ownership of self and thus avoid the clone.
Looking specifically at the use exercised by this benchmark, the find operation uses it to deserialize the response from the server in Find::handle_response:
fn handle_response(&self, response: CommandResponse) -> Result<Self::O> {
    let body: CursorBody = response.body()?;

    Ok(CursorSpecification::new(
        self.ns.clone(),
        response.source_address().clone(),
        body.cursor.id,
        self.options.as_ref().and_then(|opts| opts.batch_size),
        self.options.as_ref().and_then(|opts| opts.max_await_time),
        body.cursor.first_batch,
    ))
}
As we can see here, response is only used once after the call to body, and that one usage could come before it without issue, so this call site at least would still work if body took ownership of self. Repeating this process for the rest of the call sites, we see that body can in fact take ownership of self and thus avoid a clone, so let's make this change and see how it affects performance.
Rerunning cargo bench after making that change yields the following:
find                    time:   [47.495 ms 47.843 ms 48.279 ms]
                        change: [-15.488% -14.760% -13.944%] (p = 0.00 < 0.05)
                        Performance has improved.
Found 4 outliers among 100 measurements (4.00%)
  4 (4.00%) high severe
Nice! Even after such a simple change, we've already observed a significant improvement in performance. Let's investigate the other places where a lot of time is being spent now that some of the lower-hanging fruit has been addressed.
Speeding up deserialization
Looking back at the flamegraph, we can see that a significant portion of time was being spent parsing responses from the database wire protocol (purple) and subsequently deserializing them to Rust data structures via serde (green). Despite each one performing a similar task, the two steps were needed because the bson crate only supported deserialization from the Bson and Document Rust types, rather than actual BSON, the binary format used in the MongoDB wire protocol. The flamegraph demonstrates that this process consumed a large amount of time, and so if the two steps could be combined into one, it's possible that it could lead to significant performance benefits.
Essentially, we want to go from the following:
let bytes = socket.read(&mut bytes).await?; // read message from database
let document = Document::from_reader(bytes.as_slice())?; // parse into Document
let rust_data_type: MyType = bson::from_document(document)?; // deserialize via serde
to
let bytes = socket.read(&mut bytes).await?; // read message from database
let rust_data_type: MyType = bson::from_slice(bytes.as_slice())?; // deserialize via serde
To do this, we're going to need to implement a new serde deserializer that works with raw BSON. The work involved in that is pretty extensive and quite complicated, so I'll hold off on the details. The "Implementing a Deserializer" section of the serde docs provides an excellent example of implementing one for JSON though for those who are interested.
So, now that we implemented the deserializer and updated the driver to use it, let's rerun cargo bench to see if it had any impact on performance:
find                    time:   [30.624 ms 30.719 ms 30.822 ms]
                        change: [-36.409% -35.791% -35.263%] (p = 0.00 < 0.05)
                        Performance has improved.
Found 5 outliers among 100 measurements (5.00%)
  1 (1.00%) low mild
  1 (1.00%) high mild
  3 (3.00%) high severe
Awesome! The average iteration time was reduced by roughly 36% from the previous one, which was already a big reduction from the initial baseline. Now that we've implemented a few improvements, let's take a closer look at the results.
Analyzing results
Viewing Criterion's HTML report
Criterion includes support for generating an HTML report that summarizes the most recent run and compares it to the run before it. To access the report, simply open target/criterion/report/index.html in your browser.
As an example, here is the report comparing the baseline to the most optimized one.
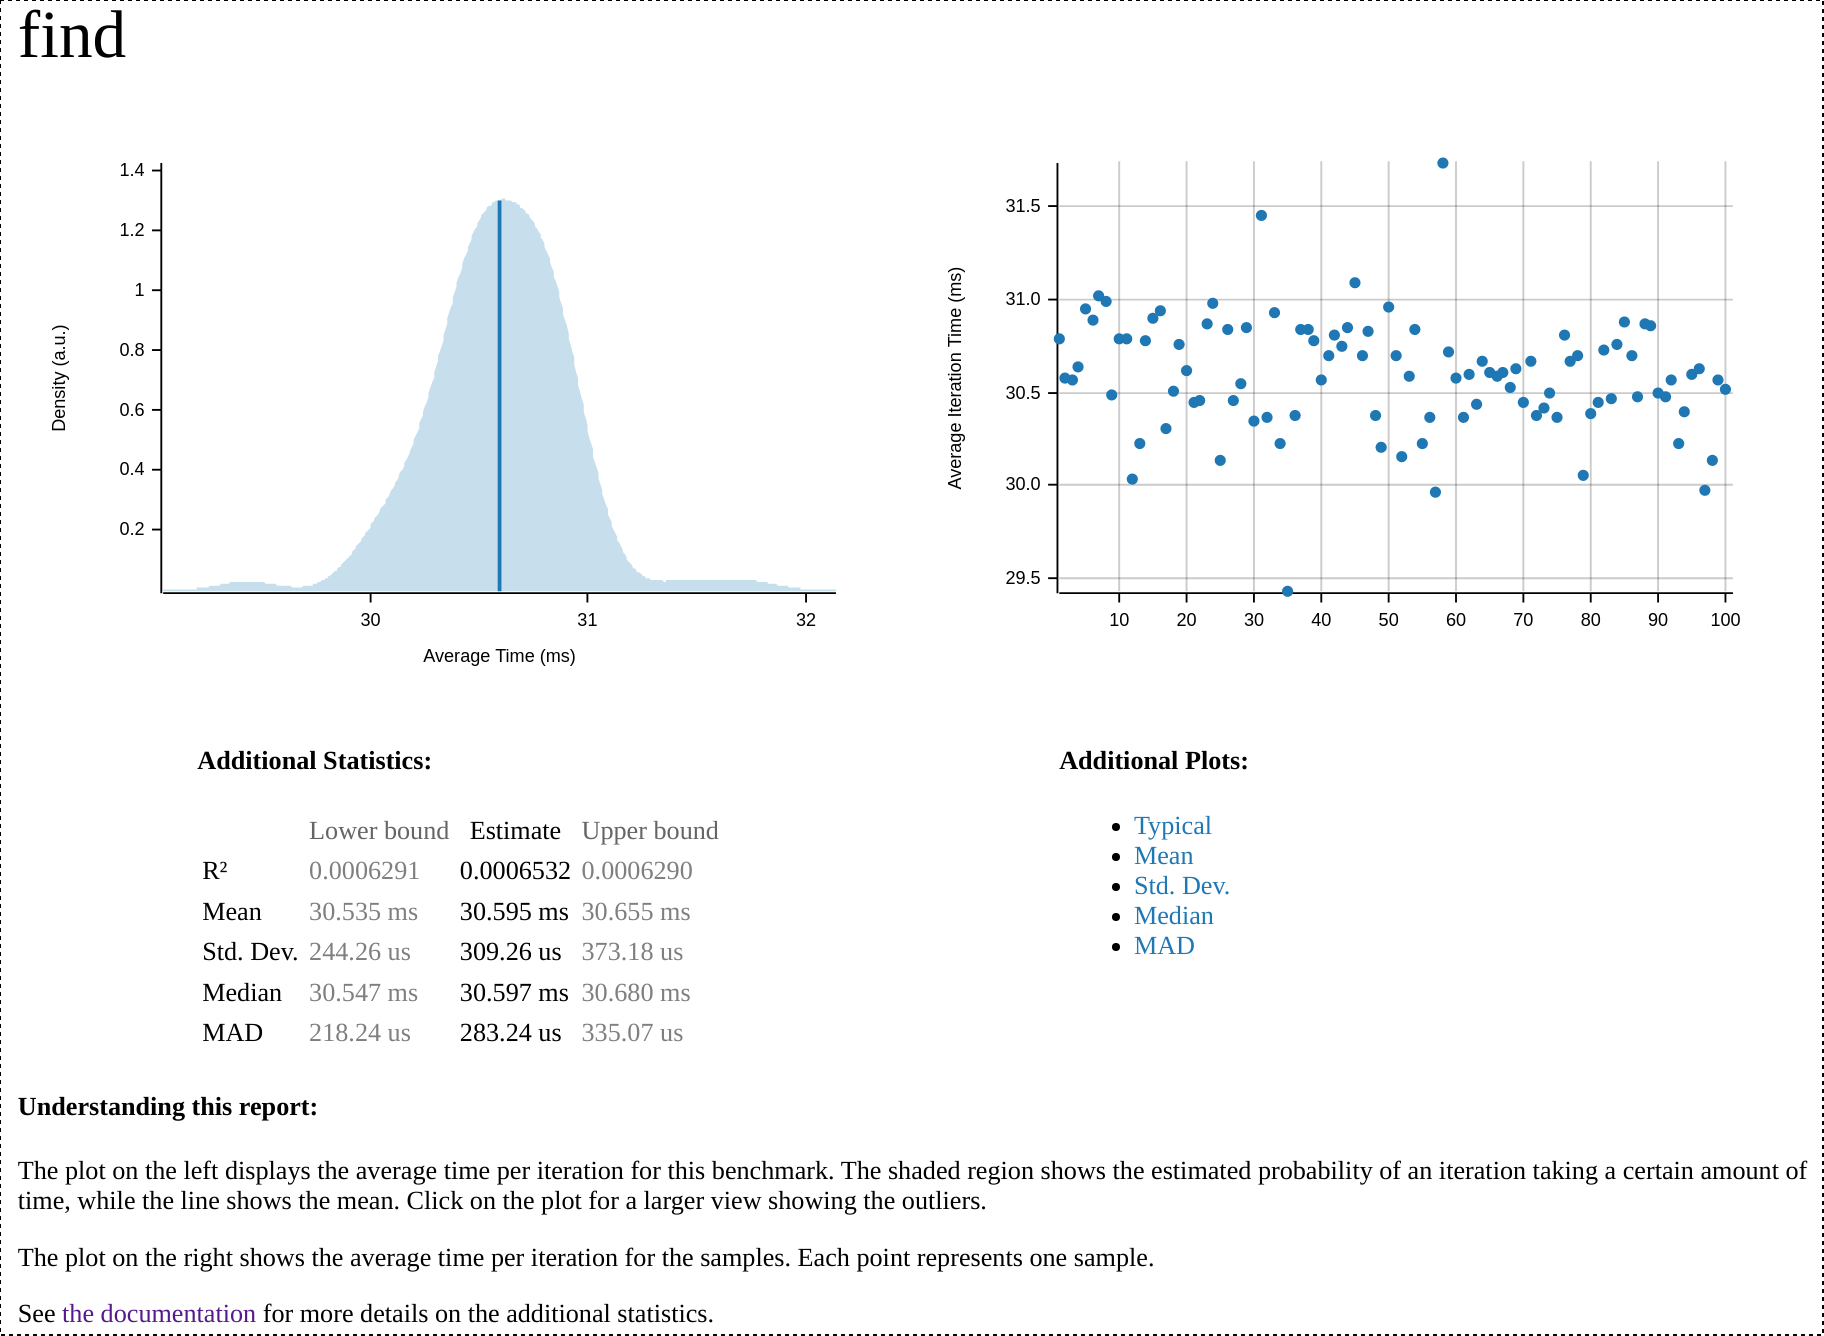
At the top of the report, we can see a summary of the most optimized run, including a graph illustrating the mean execution time and a scatter plot showing all the samples criterion took, as well as links to some other graphs. Here's a screenshot of that section for the most recent find benchmark run:
At the bottom of the report, there is a comparison between the two most recent runs, with the older run (the baseline) in red and the more recent run (the optimized one) in blue. A screenshot of the section comparing the optimized version of mongodb to the unoptimized baseline can be found below. In it, we can see that the unoptimized baseline is clearly much slower than the optimized one. Judging by the wideness of the distributions, we can also see that the optimized one is more consistent in its performance than the baseline.
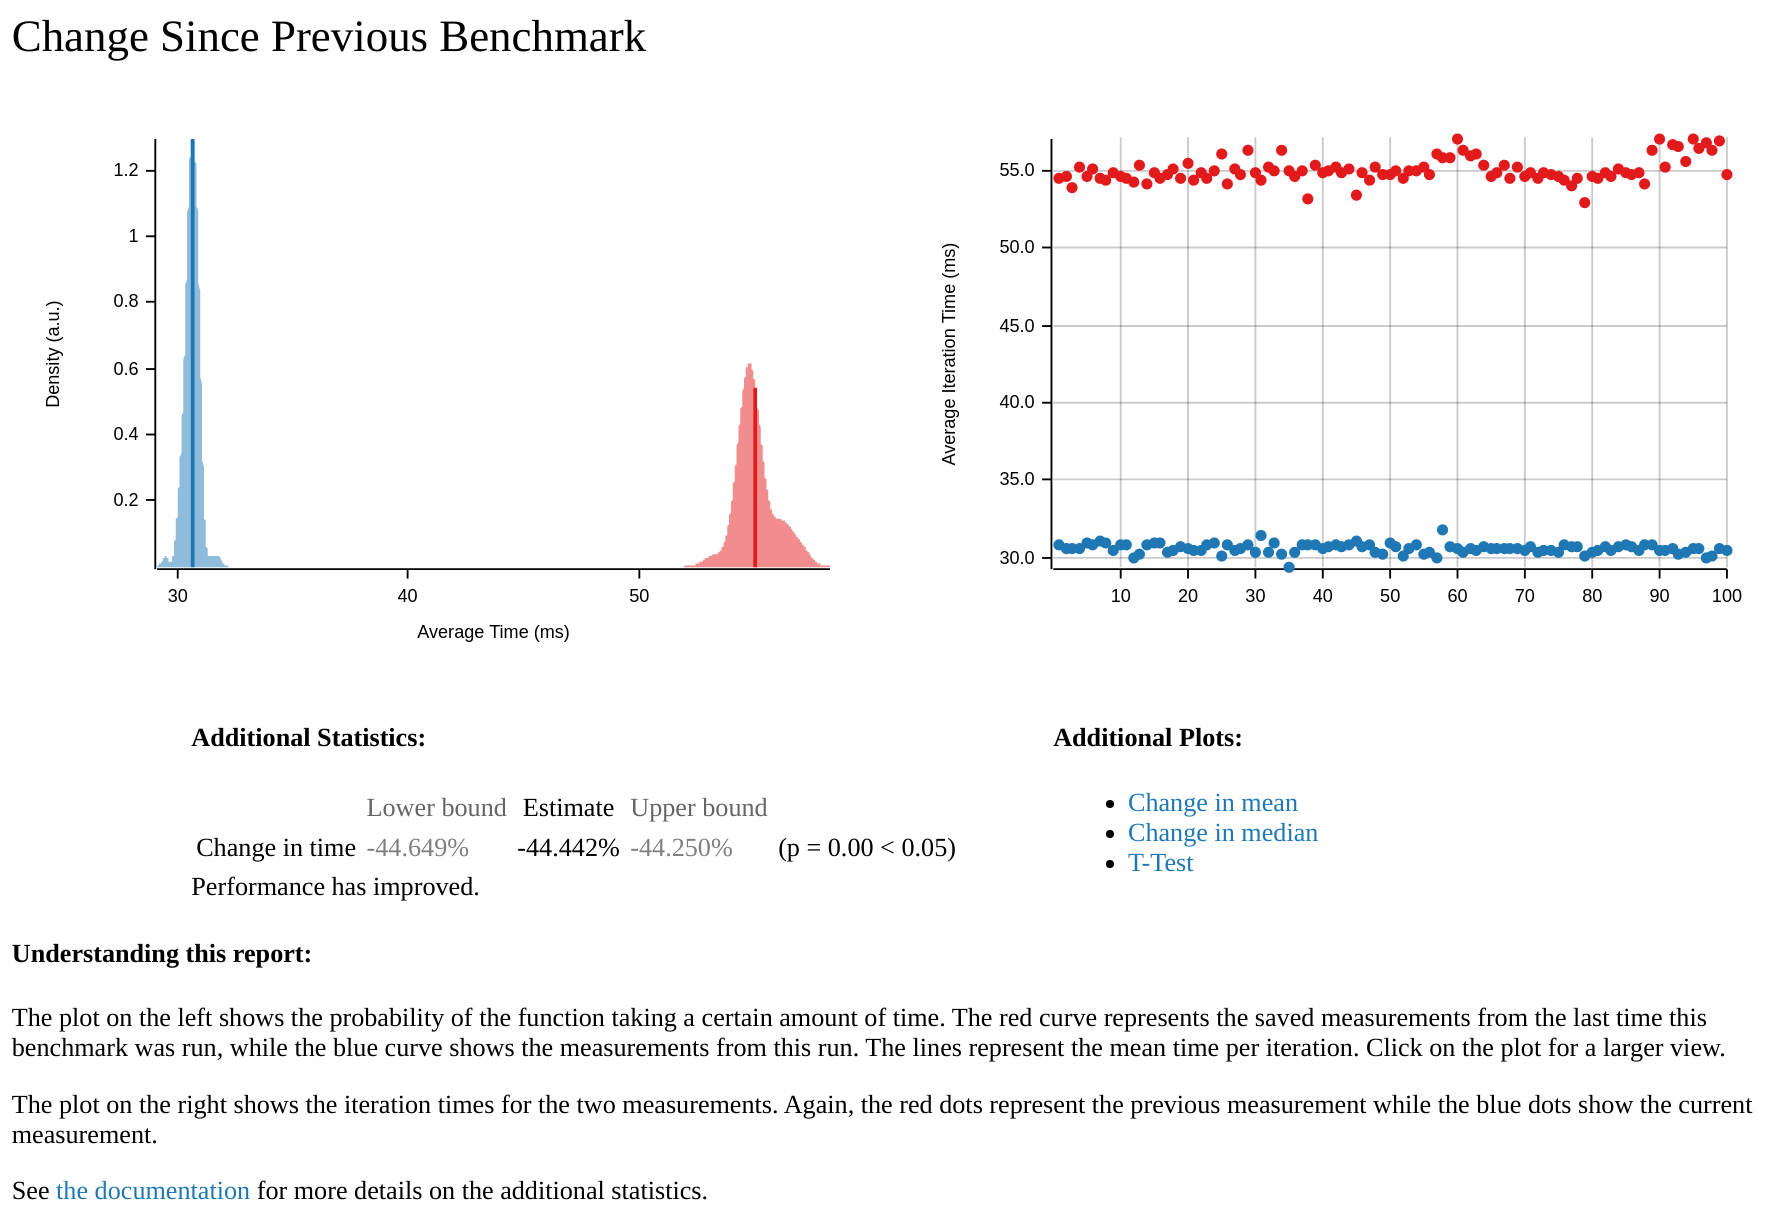
These reports are super helpful tools for visualizing the changes that occur as a result of performance tuning, and they're especially useful for presenting the results to others. They can also serve as a record of past performance data, eliminating the need to manually record the results.
Performing a realistic benchmark using wrk
While microbenchmarks are extremely useful for isolating behavior and identifying bottlenecks, they aren't always representative of real workloads. To prove the changes being made actually improve performance and are not overfitted to the microbenchmarks, it's useful to also take measurements during real-world scenarios.
In the case of an async database driver like mongodb, this means situations with a high number of concurrent requests. A useful tool for generating such requests is the wrk workload generator.
To install wrk, you'll need to clone the repo and build it from source:
git clone https://github.com/wg/wrk
cd wrk
make
./wrk --version
If that succeeded, you should see wrk's version information. For more specific installation instructions, see wrk's INSTALL page.
After spinning up an actix-web server (running in release mode) which will perform a find on every GET request, I pointed wrk at it using the following invocation:
./wrk -t8 -c100 -d10s http://127.0.0.1:8080
This runs a benchmark for 10 seconds, using 8 threads, and keeping 100 HTTP connections open.
Using the unoptimized driver, I saw the following results:
Running 10s test @ http://127.0.0.1:8080
  8 threads and 100 connections
  Thread Stats   Avg      Stdev     Max   +/- Stdev
    Latency     7.83ms    2.06ms  26.52ms   73.81%
    Req/Sec     1.54k   379.64     7.65k    91.02%
  122890 requests in 10.10s, 205.45MB read
Requests/sec:  12168.39
Transfer/sec:     20.34MB
Post optimizations, I saw this instead:
Running 10s test @ http://127.0.0.1:8080
  8 threads and 100 connections
  Thread Stats   Avg      Stdev     Max   +/- Stdev
    Latency     4.03ms    1.31ms  52.06ms   97.77%
    Req/Sec     3.03k   292.52     6.00k    92.41%
  242033 requests in 10.10s, 404.63MB read
Requests/sec:  23964.39
Transfer/sec:     40.06MB
...which represents almost a 100% increase in throughput, awesome! This means our optimizations based on microbenchmarking are translating to significant improvements in real workloads.
Next steps
In this post, we've seen how you can use just a few fundamental performance techniques (generating flamegraphs, benchmarking) to achieve significant performance improvements in your Rust application. The process for this can be summarized in the following steps:
- Run a benchmark using
criterionto establish a baseline - Identify bottlenecks via
cargo flamegraph - Attempt to fix bottlenecks
- Re-run benchmark to see if bottleneck was fixed
- Repeat
This process can be repeated over and over until a satisfactory level of performance is reached. However, as you iterate, the improvements are likely to become less dramatic and require more effort to implement. For example, in the case of mongodb, the first big improvement came from simply being more judicious about using clone(), but to achieve a similar level of improvement after that, an entire serde deserializer needed to be implemented! This leads to another reason why profiling is so important: in addition to identifying where optimizations need to occur, it can also help determine when they need to occur (or conversely, when they should stop). If the remaining improvements are not worth the effort, profiling can show that and allow you to focus your efforts elsewhere. This is important because no matter how optimized something is, there's always room for improvement, and it's easy to go down the rabbit hole of over optimization.
Conclusion
I hope this overview of profiling and benchmarking in Rust was helpful. Note that optimizing your Rust application or library to be as fast as technically possible isn't always necessary or even desirable, since optimized code is often harder to understand and maintain than simple but slow code. What's more important is that your application or library meets its performance expectations. For instance, it makes little difference if a CLI tool's self-update takes 50ms or 100ms, despite there being a possible 50% reduction in runtime, because 100ms is well within the expected level of performance for such functionality. However, for cases where performance is not meeting expectations, the process outlined in this post can be very effective at producing optimizations, as can be seen in the recent improvements we made to the mongodb crate.
Shameless plug
We recently released version v2.0.0 of the mongodb crate, which contains the performance improvements mentioned in this post as well as a ton of new features, including support for transactions! If interested in writing a web application in Rust, please do check out the MongoDB Rust driver if you're in need of a database!
References
Acknowledgments
Thanks to @univerz for their initial investigation into these bottlenecks.